Visualization
Processing provides powerful visualization tools that allows me to generate visual representations of the data I collect from Twitter. Using a combination of my own code to generate the coordinates and that of Aaron Koblin for creating the visualization. His code can be downloaded from Google Code here and is licensed under the Apache license.
I've chosen to use Processing with the program written to produce the band Radiohead's music video for the song "House of Cards". The program can be downloaded at it's Google Code page.
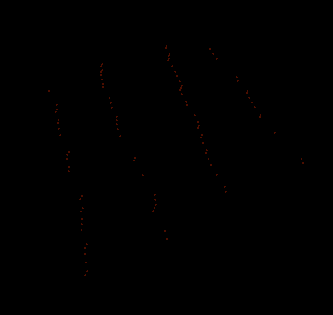
This image represents the first 100 tweets from my sample. With this few tweets it is fairly uninteresting. I am excited to see all 73,000 in one place! I will also be experimenting with color and intensity to represent different data and make the image more legible.
